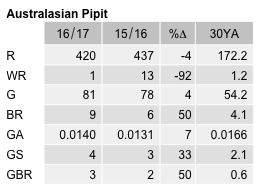
Australasian Pipit
Anthus novaeseelandiae
ABR description
The following is extracted from the Annual Bird Report for the twelve months to June 2017.
Common, breeding resident
Found in most grasslands around the ACT.
General: A slight decrease in records but bird numbers are 38% up, while the reporting rate is marginally lower than last year, the abundance measure is up 14%. Nevertheless, the reporting rate has only been lower in the period 2002-2004. Mainly observed in spring (37%) and summer (33%). Mean 3.5, median 2, and max 69/2 Oct LGeo Anderson VC Rest Area (AnF1). 9 breeding records from 8 sites: earliest di/JWNR (SmA1) and latest cf/22 Jan LBath (LeM1).
GBS: 24 records from 4 sites (6.8%), mainly in spring (54%) and summer (37%), mainly from Curtin. Max 4/5wk Oct Curtin (AjR1), also the first (cf) breeding record. Abundance back to normal levels. Mean 2.5, median 2. 3 breeding records at one site (cf and dy) in Oct/Jan at Curtin (AjR1).
Abundance
Abundance is the average number of birds of that species per survey. Where the species was observed (presence recorded) but the number of birds seen was not recorded, this is treated as a count of zero.
Abundance by year
This chart shows the abundance of Australasian Pipit between 1982 and 2017. 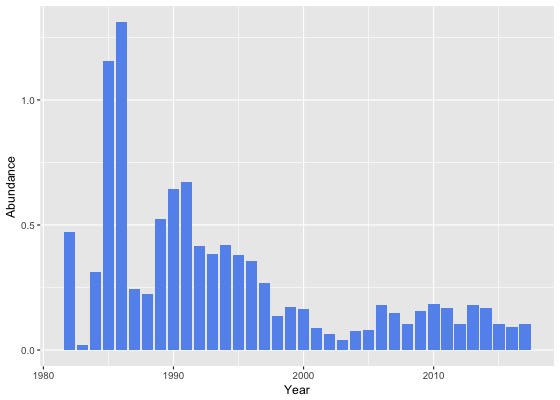
Abundance by month
This chart shows the monthly abundance of Australasian Pipit. The blue lines show the abundance for the twelve months to June 2017 and the bars show the average abundance for the period 1982 to 2017. 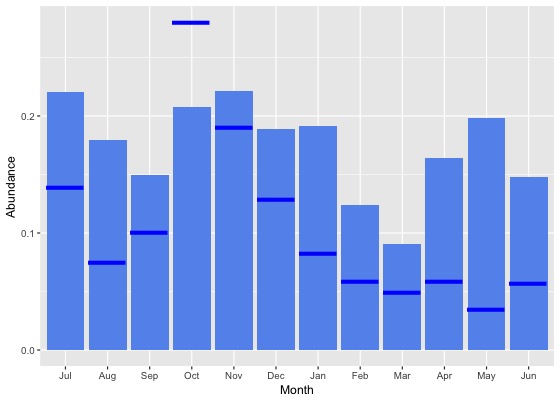
Abundance by season
This chart shows the seasonal abundance of Australasian Pipit. The blue lines show the seasonal abundance for the twelve months to June 2017 and the bars show the average seasonal abundance for the period 1982 to 2017. 
Abundance data
| Month | Season | ||||||||||||||||||
|---|---|---|---|---|---|---|---|---|---|---|---|---|---|---|---|---|---|---|---|
| Period | Jul | Aug | Sep | Oct | Nov | Dec | Jan | Feb | Mar | Apr | May | Jun | Winter | Spring | Summer | Autumn | All | ||
| All years | |||||||||||||||||||
| All | 0.2 | 0.2 | 0.1 | 0.2 | 0.2 | 0.2 | 0.2 | 0.1 | 0.1 | 0.2 | 0.2 | 0.1 | 0.2 | 0.2 | 0.2 | 0.1 | 0.2 | ||
| Previous years | |||||||||||||||||||
| All previous years | 0.2 | 0.2 | 0.2 | 0.2 | 0.2 | 0.2 | 0.2 | 0.1 | 0.1 | 0.2 | 0.2 | 0.2 | 0.2 | 0.2 | 0.2 | 0.2 | 0.2 | ||
| Previous 30 years | 0.2 | 0.2 | 0.1 | 0.2 | 0.2 | 0.2 | 0.2 | 0.1 | 0.1 | 0.2 | 0.2 | 0.2 | 0.2 | 0.2 | 0.2 | 0.1 | 0.2 | ||
| Previous 20 years | 0.2 | 0.1 | 0.1 | 0.2 | 0.2 | 0.1 | 0.2 | 0.1 | 0.1 | 0.1 | 0.1 | 0.1 | 0.1 | 0.2 | 0.1 | 0.1 | 0.1 | ||
| 10 year groups | |||||||||||||||||||
| [2007,2017) | 0.2 | 0.1 | 0.1 | 0.2 | 0.2 | 0.1 | 0.2 | 0.1 | 0.0 | 0.1 | 0.1 | 0.1 | 0.1 | 0.2 | 0.1 | 0.1 | 0.1 | ||
| [1997,2007) | 0.2 | 0.1 | 0.1 | 0.1 | 0.1 | 0.1 | 0.2 | 0.1 | 0.1 | 0.1 | 0.1 | 0.0 | 0.1 | 0.1 | 0.1 | 0.1 | 0.1 | ||
| [1987,1997) | 0.3 | 0.4 | 0.3 | 0.4 | 0.3 | 0.5 | 0.4 | 0.3 | 0.3 | 0.5 | 0.5 | 0.5 | 0.4 | 0.3 | 0.4 | 0.4 | 0.4 | ||
| 5 year groups | |||||||||||||||||||
| [2012,2017) | 0.2 | 0.1 | 0.1 | 0.1 | 0.2 | 0.2 | 0.2 | 0.1 | 0.0 | 0.1 | 0.1 | 0.1 | 0.1 | 0.2 | 0.1 | 0.1 | 0.1 | ||
| [2007,2012) | 0.2 | 0.1 | 0.1 | 0.2 | 0.3 | 0.1 | 0.2 | 0.1 | 0.0 | 0.2 | 0.2 | 0.1 | 0.1 | 0.2 | 0.1 | 0.1 | 0.2 | ||
| [2002,2007) | 0.1 | 0.1 | 0.1 | 0.1 | 0.1 | 0.1 | 0.1 | 0.1 | 0.1 | 0.1 | 0.1 | 0.0 | 0.1 | 0.1 | 0.1 | 0.1 | 0.1 | ||
| [1997,2002) | 0.4 | 0.1 | 0.2 | 0.1 | 0.1 | 0.1 | 0.3 | 0.1 | 0.1 | 0.1 | 0.2 | 0.1 | 0.2 | 0.2 | 0.2 | 0.1 | 0.2 | ||
| [1992,1997) | 0.5 | 0.4 | 0.3 | 0.3 | 0.3 | 0.3 | 0.5 | 0.2 | 0.3 | 0.5 | 0.5 | 0.6 | 0.5 | 0.3 | 0.4 | 0.4 | 0.4 | ||
| [1987,1992) | 0.3 | 0.4 | 0.3 | 0.4 | 0.3 | 0.6 | 0.3 | 0.3 | 0.2 | 0.5 | 0.6 | 0.5 | 0.4 | 0.4 | 0.4 | 0.4 | 0.4 | ||
| Year | |||||||||||||||||||
| 2017 | 0.1 | 0.1 | 0.1 | 0.3 | 0.2 | 0.1 | 0.1 | 0.1 | 0.0 | 0.1 | 0.0 | 0.1 | 0.1 | 0.2 | 0.1 | 0.0 | 0.1 | ||
| 2016 | 0.1 | 0.1 | 0.1 | 0.2 | 0.1 | 0.1 | 0.1 | 0.1 | 0.0 | 0.0 | 0.0 | 0.2 | 0.1 | 0.1 | 0.1 | 0.0 | 0.1 | ||
| 2015 | 0.2 | 0.1 | 0.1 | 0.1 | 0.3 | 0.2 | 0.1 | 0.0 | 0.0 | 0.1 | 0.1 | 0.1 | 0.1 | 0.2 | 0.1 | 0.0 | 0.1 | ||
| 2014 | 0.1 | 0.2 | 0.1 | 0.2 | 0.3 | 0.2 | 0.3 | 0.1 | 0.1 | 0.1 | 0.2 | 0.1 | 0.1 | 0.2 | 0.2 | 0.1 | 0.2 | ||
| 2013 | 0.2 | 0.2 | 0.1 | 0.1 | 0.2 | 0.2 | 0.2 | 0.2 | 0.1 | 0.2 | 0.3 | 0.1 | 0.2 | 0.2 | 0.2 | 0.2 | 0.2 | ||
| 2012 | 0.2 | 0.1 | 0.1 | 0.1 | 0.2 | 0.1 | 0.1 | 0.1 | 0.0 | 0.0 | 0.1 | 0.1 | 0.1 | 0.1 | 0.1 | 0.0 | 0.1 | ||
| 2011 | 0.1 | 0.1 | 0.1 | 0.2 | 0.5 | 0.1 | 0.2 | 0.2 | 0.0 | 0.1 | 0.3 | 0.1 | 0.1 | 0.2 | 0.2 | 0.1 | 0.2 | ||
| 2010 | 0.5 | 0.2 | 0.1 | 0.2 | 0.4 | 0.2 | 0.1 | 0.2 | 0.1 | 0.2 | 0.2 | 0.0 | 0.2 | 0.2 | 0.2 | 0.2 | 0.2 | ||
| 2009 | 0.2 | 0.1 | 0.1 | 0.2 | 0.2 | 0.3 | 0.3 | 0.1 | 0.0 | 0.1 | 0.3 | 0.0 | 0.1 | 0.2 | 0.2 | 0.1 | 0.2 | ||
| 2008 | 0.0 | 0.1 | 0.0 | 0.2 | 0.2 | 0.1 | 0.2 | 0.0 | 0.1 | 0.1 | 0.1 | 0.1 | 0.1 | 0.1 | 0.1 | 0.1 | 0.1 | ||
| 2007 | 0.3 | 0.1 | 0.0 | 0.2 | 0.2 | 0.1 | 0.1 | 0.0 | 0.1 | 0.2 | 0.3 | 0.2 | 0.2 | 0.2 | 0.1 | 0.2 | 0.1 | ||
| 2006 | 0.1 | 0.5 | 0.1 | 0.2 | 0.1 | 0.2 | 0.3 | 0.3 | 0.2 | 0.2 | 0.1 | 0.1 | 0.2 | 0.2 | 0.2 | 0.1 | 0.2 | ||
| 2005 | 0.1 | 0.0 | 0.0 | 0.1 | 0.1 | 0.1 | 0.1 | 0.1 | 0.1 | 0.0 | 0.0 | 0.1 | 0.1 | 0.1 | 0.1 | 0.1 | 0.1 | ||
| 2004 | 0.2 | 0.0 | 0.1 | 0.1 | 0.1 | 0.1 | 0.0 | 0.0 | 0.1 | 0.0 | 0.1 | 0.0 | 0.1 | 0.1 | 0.1 | 0.1 | 0.1 | ||
| 2003 | 0.0 | 0.1 | 0.1 | 0.0 | 0.1 | 0.0 | 0.0 | 0.0 | 0.0 | 0.1 | 0.0 | 0.0 | 0.0 | 0.1 | 0.0 | 0.0 | 0.0 | ||
| 2002 | 0.1 | 0.1 | 0.0 | 0.2 | 0.1 | 0.0 | 0.2 | 0.1 | 0.0 | 0.0 | 0.1 | 0.0 | 0.1 | 0.1 | 0.1 | 0.0 | 0.1 | ||
| 2001 | 0.0 | 0.0 | 0.1 | 0.1 | 0.1 | 0.1 | 0.2 | 0.0 | 0.0 | 0.1 | 0.1 | 0.0 | 0.0 | 0.1 | 0.1 | 0.1 | 0.1 | ||
| 2000 | 0.2 | 0.1 | 0.1 | 0.1 | 0.2 | 0.0 | 0.4 | 0.1 | 0.2 | 0.2 | 0.3 | 0.2 | 0.2 | 0.1 | 0.2 | 0.2 | 0.2 | ||
| 1999 | 2.5 | 0.2 | 0.2 | 0.2 | 0.0 | 0.3 | 0.1 | 0.0 | 0.1 | 0.1 | 0.2 | 0.1 | 0.3 | 0.1 | 0.1 | 0.1 | 0.2 | ||
| 1998 | 0.0 | 0.6 | 0.1 | 0.1 | 0.1 | 0.2 | 0.3 | 0.2 | 0.0 | 0.0 | 0.0 | 0.0 | 0.2 | 0.1 | 0.2 | 0.0 | 0.1 | ||
| 1997 | 0.7 | 0.1 | 1.0 | 0.1 | 0.1 | 0.1 | 0.3 | 0.1 | 0.1 | 0.0 | 0.1 | 0.0 | 0.3 | 0.4 | 0.2 | 0.0 | 0.3 | ||
| 1996 | 0.1 | 0.7 | 0.0 | 0.1 | 0.4 | 0.1 | 0.5 | 0.6 | 0.2 | 0.3 | 0.2 | 0.9 | 0.6 | 0.2 | 0.4 | 0.2 | 0.4 | ||
| 1995 | 0.6 | 0.4 | 0.3 | 0.3 | 0.2 | 0.2 | 0.3 | 0.0 | 0.4 | 0.5 | 0.4 | 0.9 | 0.6 | 0.2 | 0.2 | 0.4 | 0.4 | ||
| 1994 | 0.5 | 0.5 | 0.4 | 0.2 | 0.2 | 0.5 | 0.9 | 0.0 | 0.2 | 0.5 | 0.7 | 0.4 | 0.5 | 0.3 | 0.5 | 0.5 | 0.4 | ||
| 1993 | 0.6 | 0.1 | 0.4 | 0.4 | 0.4 | 0.2 | 0.6 | 0.0 | 0.2 | 0.5 | 0.8 | 0.2 | 0.3 | 0.4 | 0.3 | 0.5 | 0.4 | ||
| 1992 | 0.7 | 0.1 | 0.4 | 0.4 | 0.6 | 0.6 | 0.2 | 0.3 | 0.3 | 0.6 | 0.4 | 0.5 | 0.4 | 0.4 | 0.4 | 0.4 | 0.4 | ||
| 1991 | 0.2 | 0.8 | 0.5 | 0.6 | 0.8 | 0.9 | 0.2 | 0.8 | 0.4 | 1.2 | 0.6 | 1.7 | 0.7 | 0.6 | 0.7 | 0.7 | 0.7 | ||
| 1990 | 0.4 | 0.5 | 0.4 | 0.8 | 0.1 | 1.8 | 0.3 | 0.5 | 0.8 | 1.2 | 0.7 | 0.8 | 0.5 | 0.4 | 0.9 | 0.9 | 0.6 | ||
| 1989 | 0.3 | 0.5 | 0.4 | 0.5 | 0.3 | 0.6 | 0.4 | 0.4 | 0.3 | 0.6 | 1.6 | 0.8 | 0.5 | 0.4 | 0.5 | 0.8 | 0.5 | ||
| 1988 | 0.1 | 0.2 | 0.3 | 0.2 | 0.3 | 0.3 | 0.2 | 0.3 | 0.1 | 0.3 | 0.2 | 0.3 | 0.2 | 0.3 | 0.3 | 0.2 | 0.2 | ||
| 1987 | 2.2 | 0.4 | 0.2 | 0.3 | 0.4 | 0.3 | 0.4 | 0.2 | 0.1 | 0.1 | 0.2 | 0.2 | 0.3 | 0.3 | 0.3 | 0.1 | 0.2 | ||
| 1986 | 2.8 | 0.2 | 0.4 | 1.1 | 0.8 | 3.9 | 0.6 | 0.4 | 1.0 | 2.8 | 0.6 | 1.2 | 1.3 | 0.7 | 1.7 | 1.7 | 1.3 | ||
| 1985 | 0.9 | 0.7 | 1.9 | 0.3 | 0.2 | 0.7 | 3.9 | 3.2 | 4.7 | 1.1 | 7.5 | 0.4 | 0.7 | 0.7 | 1.5 | 3.7 | 1.2 | ||
| 1984 | 0.8 | 0.0 | 0.0 | 0.0 | 0.0 | 0.5 | 1.1 | 0.0 | 0.0 | 0.0 | 1.0 | 0.0 | 0.1 | 0.0 | 0.5 | 0.3 | 0.3 | ||
| 1983 | 0.0 | 0.2 | 0.0 | 0.0 | 0.0 | 0.0 | 0.0 | 0.0 | 0.0 | - | 0.0 | 0.0 | 0.1 | 0.0 | 0.0 | 0.0 | 0.0 | ||
| 1982 | - | 0.0 | - | 0.0 | 0.0 | 0.1 | - | 0.0 | - | 2.5 | - | 0.0 | 0.0 | 0.0 | 0.0 | 2.5 | 0.5 | ||
Reporting rates
Reporting rate is the proportion of all surveys in which the species was present.
Reporting rate by year
This chart shows the reporting rate of Australasian Pipit each year between 1982 and 2017. 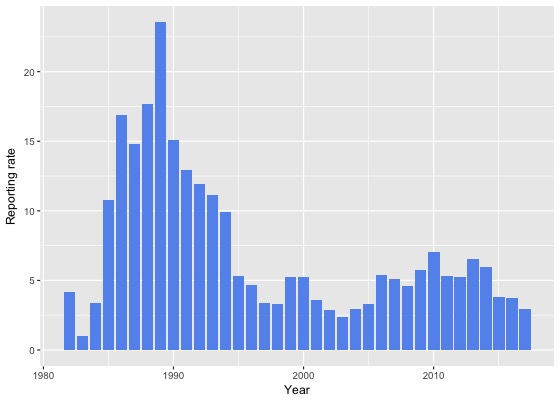
Reporting rate by month
This chart shows the reporting rate by month of Australasian Pipit. The blue lines show the reporting rate for the twelve months to June 2017 and the bars show the average reporting rate for the period 1982 to 2017. 
Reporting rate by season
This chart shows the seasonal reporting rate of Australasian Pipit. The blue lines show the seasonal reporting rate for the twelve months to June 2017 and the bars show the average seasonal reporting rate for the period 1982 to 2017. 
Reporting rate data
| Month | Season | ||||||||||||||||||
|---|---|---|---|---|---|---|---|---|---|---|---|---|---|---|---|---|---|---|---|
| Period | Jul | Aug | Sep | Oct | Nov | Dec | Jan | Feb | Mar | Apr | May | Jun | Winter | Spring | Summer | Autumn | All | ||
| All years | |||||||||||||||||||
| All | 5.4 | 6.4 | 5.8 | 8.3 | 9.2 | 7.2 | 7.3 | 4.4 | 2.9 | 4.5 | 4.8 | 3.3 | 4.8 | 7.8 | 6.4 | 4.0 | 5.9 | ||
| Previous years | |||||||||||||||||||
| All previous years | 5.7 | 7.1 | 6.1 | 8.8 | 9.8 | 7.5 | 8.0 | 4.9 | 3.3 | 4.9 | 5.7 | 3.6 | 5.2 | 8.2 | 6.9 | 4.5 | 6.4 | ||
| Previous 30 years | 5.6 | 7.1 | 6.1 | 8.8 | 9.8 | 7.4 | 7.9 | 4.8 | 3.2 | 4.8 | 5.5 | 3.5 | 5.2 | 8.2 | 6.9 | 4.4 | 6.3 | ||
| Previous 20 years | 4.0 | 4.7 | 4.0 | 7.4 | 7.3 | 5.3 | 6.6 | 3.3 | 2.1 | 3.2 | 3.6 | 2.2 | 3.4 | 6.3 | 5.2 | 2.8 | 4.6 | ||
| 10 year groups | |||||||||||||||||||
| [2007,2017) | 4.5 | 4.9 | 4.4 | 7.7 | 8.5 | 5.9 | 6.8 | 3.2 | 1.9 | 3.2 | 3.7 | 2.3 | 3.6 | 6.9 | 5.5 | 2.8 | 4.9 | ||
| [1997,2007) | 3.1 | 4.4 | 3.3 | 6.4 | 4.8 | 4.0 | 5.9 | 3.6 | 2.4 | 3.2 | 3.2 | 1.9 | 2.9 | 4.8 | 4.5 | 2.9 | 3.8 | ||
| [1987,1997) | 11.5 | 14.3 | 16.4 | 17.2 | 18.1 | 19.6 | 15.5 | 12.0 | 9.6 | 13.4 | 12.7 | 10.3 | 12.1 | 17.3 | 15.8 | 11.9 | 14.4 | ||
| 5 year groups | |||||||||||||||||||
| [2012,2017) | 4.2 | 4.6 | 4.6 | 7.0 | 8.0 | 6.6 | 6.7 | 2.7 | 1.7 | 2.6 | 3.1 | 2.4 | 3.6 | 6.5 | 5.5 | 2.4 | 4.7 | ||
| [2007,2012) | 5.4 | 5.9 | 4.0 | 8.7 | 9.8 | 4.5 | 7.2 | 4.9 | 2.5 | 4.4 | 5.5 | 2.1 | 3.7 | 7.6 | 5.6 | 4.0 | 5.6 | ||
| [2002,2007) | 2.9 | 4.5 | 2.6 | 6.4 | 4.5 | 4.0 | 5.1 | 3.6 | 2.1 | 2.0 | 2.4 | 1.2 | 2.6 | 4.5 | 4.2 | 2.1 | 3.4 | ||
| [1997,2002) | 3.3 | 4.2 | 4.2 | 6.3 | 5.2 | 4.0 | 6.7 | 3.5 | 2.9 | 4.7 | 4.1 | 2.9 | 3.4 | 5.1 | 4.7 | 3.8 | 4.3 | ||
| [1992,1997) | 8.3 | 5.6 | 9.2 | 10.5 | 12.2 | 9.7 | 10.2 | 3.6 | 5.5 | 7.5 | 7.6 | 5.0 | 6.1 | 10.7 | 8.2 | 6.8 | 8.1 | ||
| [1987,1992) | 12.9 | 19.0 | 19.8 | 20.9 | 20.9 | 23.9 | 18.5 | 15.2 | 12.1 | 16.8 | 15.3 | 13.3 | 15.2 | 20.6 | 19.3 | 14.8 | 17.7 | ||
| Year | |||||||||||||||||||
| 2017 | 3.4 | 3.0 | 3.5 | 4.5 | 5.2 | 5.3 | 3.7 | 2.1 | 1.0 | 1.6 | 1.3 | 1.5 | 2.4 | 4.4 | 3.7 | 1.3 | 3.0 | ||
| 2016 | 2.5 | 4.0 | 3.8 | 7.7 | 5.7 | 5.3 | 5.1 | 2.1 | 1.3 | 1.9 | 1.6 | 3.0 | 3.2 | 5.9 | 4.1 | 1.6 | 3.7 | ||
| 2015 | 4.0 | 3.6 | 5.0 | 5.3 | 8.0 | 5.6 | 5.1 | 1.8 | 0.9 | 2.3 | 2.3 | 1.6 | 2.8 | 5.9 | 4.3 | 1.8 | 3.8 | ||
| 2014 | 5.5 | 7.1 | 4.4 | 8.5 | 7.8 | 7.8 | 9.6 | 3.4 | 3.2 | 3.6 | 5.5 | 2.6 | 4.6 | 7.1 | 7.4 | 3.9 | 5.9 | ||
| 2013 | 4.5 | 6.3 | 5.0 | 6.3 | 11.8 | 9.8 | 9.7 | 5.0 | 3.0 | 4.7 | 6.7 | 2.5 | 4.3 | 7.5 | 8.6 | 4.3 | 6.6 | ||
| 2012 | 7.5 | 3.9 | 5.4 | 7.5 | 9.0 | 5.7 | 6.4 | 4.4 | 0.9 | 1.9 | 3.7 | 2.4 | 4.4 | 7.3 | 5.8 | 1.9 | 5.3 | ||
| 2011 | 4.9 | 5.6 | 5.8 | 8.9 | 9.7 | 3.6 | 9.5 | 5.0 | 0.9 | 4.1 | 3.6 | 2.3 | 3.5 | 8.2 | 6.2 | 2.8 | 5.3 | ||
| 2010 | 9.4 | 9.6 | 5.2 | 9.5 | 12.0 | 5.8 | 6.3 | 8.2 | 3.9 | 6.4 | 8.8 | 2.7 | 5.7 | 8.8 | 6.3 | 5.8 | 7.0 | ||
| 2009 | 2.9 | 5.2 | 3.4 | 10.1 | 7.6 | 7.4 | 7.3 | 6.7 | 2.3 | 3.3 | 6.9 | 0.5 | 2.2 | 7.8 | 7.2 | 3.7 | 5.8 | ||
| 2008 | 4.1 | 3.5 | 2.6 | 7.6 | 8.1 | 3.2 | 7.9 | 2.8 | 2.2 | 3.4 | 6.3 | 0.9 | 2.5 | 6.3 | 4.4 | 3.6 | 4.6 | ||
| 2007 | 7.7 | 5.6 | 2.9 | 7.5 | 12.2 | 3.7 | 4.3 | 2.6 | 3.4 | 5.6 | 4.9 | 3.3 | 4.5 | 7.0 | 3.7 | 4.6 | 5.1 | ||
| 2006 | 3.3 | 11.7 | 4.8 | 7.9 | 6.5 | 7.3 | 10.1 | 5.9 | 4.1 | 3.2 | 1.4 | 0.8 | 3.7 | 6.7 | 7.9 | 3.3 | 5.4 | ||
| 2005 | 2.2 | 0.9 | 1.1 | 7.7 | 4.8 | 4.8 | 5.7 | 3.3 | 1.3 | 2.2 | 3.0 | 3.1 | 2.4 | 4.0 | 4.8 | 2.1 | 3.3 | ||
| 2004 | 3.2 | 3.3 | 2.4 | 3.5 | 3.5 | 5.5 | 3.6 | 2.0 | 2.1 | 1.1 | 3.9 | 0.6 | 2.5 | 3.1 | 4.2 | 2.1 | 2.9 | ||
| 2003 | 1.7 | 3.6 | 3.8 | 4.1 | 3.2 | 2.1 | 0.7 | 2.2 | 1.3 | 2.8 | 0.8 | 0.6 | 1.9 | 3.7 | 1.8 | 1.8 | 2.4 | ||
| 2002 | 3.4 | 4.2 | 1.0 | 6.9 | 5.0 | 2.1 | 4.4 | 4.6 | 0.5 | 0.6 | 3.5 | 0.0 | 2.3 | 4.4 | 3.2 | 1.1 | 2.9 | ||
| 2001 | 1.3 | 1.2 | 4.2 | 8.0 | 5.1 | 4.3 | 6.0 | 1.5 | 2.1 | 3.4 | 1.7 | 3.4 | 2.0 | 5.6 | 4.0 | 2.4 | 3.6 | ||
| 2000 | 7.1 | 5.9 | 2.3 | 6.2 | 7.4 | 2.3 | 7.0 | 4.3 | 5.3 | 8.0 | 5.5 | 3.2 | 5.2 | 5.3 | 4.4 | 6.4 | 5.3 | ||
| 1999 | 8.8 | 6.2 | 5.7 | 6.9 | 5.2 | 9.4 | 5.1 | 2.9 | 1.6 | 5.7 | 5.1 | 4.2 | 5.2 | 6.0 | 5.9 | 4.1 | 5.3 | ||
| 1998 | 0.0 | 5.7 | 4.9 | 3.3 | 3.5 | 0.9 | 7.4 | 5.7 | 2.2 | 0.0 | 7.4 | 0.0 | 1.8 | 4.0 | 4.0 | 2.5 | 3.3 | ||
| 1997 | 2.3 | 3.4 | 4.5 | 3.9 | 2.6 | 2.9 | 11.8 | 7.0 | 2.5 | 0.0 | 4.4 | 0.0 | 1.8 | 3.6 | 6.1 | 1.5 | 3.3 | ||
| 1996 | 1.5 | 4.3 | 1.3 | 4.4 | 4.6 | 5.1 | 7.8 | 5.9 | 2.9 | 4.7 | 8.6 | 4.6 | 3.6 | 3.7 | 6.3 | 4.9 | 4.6 | ||
| 1995 | 5.4 | 3.9 | 5.8 | 7.9 | 3.6 | 6.9 | 9.7 | 0.0 | 8.2 | 3.2 | 3.9 | 2.1 | 3.8 | 6.1 | 6.5 | 5.0 | 5.3 | ||
| 1994 | 9.8 | 10.4 | 14.7 | 5.8 | 15.4 | 19.6 | 13.2 | 1.7 | 4.5 | 9.2 | 8.8 | 6.7 | 8.8 | 12.4 | 11.0 | 7.7 | 9.9 | ||
| 1993 | 16.3 | 5.1 | 14.5 | 24.0 | 19.7 | 8.7 | 14.3 | 3.1 | 6.2 | 8.3 | 9.1 | 2.9 | 7.1 | 19.7 | 9.4 | 7.8 | 11.2 | ||
| 1992 | 12.3 | 5.6 | 11.8 | 16.0 | 23.6 | 14.3 | 8.6 | 7.3 | 5.6 | 15.3 | 7.9 | 10.0 | 9.5 | 16.7 | 10.5 | 9.2 | 11.9 | ||
| 1991 | 3.9 | 7.4 | 15.1 | 13.6 | 20.6 | 12.2 | 7.1 | 10.0 | 11.1 | 20.3 | 21.3 | 20.0 | 8.1 | 16.4 | 10.0 | 17.5 | 12.9 | ||
| 1990 | 14.2 | 16.8 | 11.8 | 13.3 | 13.1 | 23.6 | 11.1 | 12.7 | 20.5 | 16.7 | 15.1 | 11.8 | 14.9 | 12.8 | 15.8 | 17.6 | 15.1 | ||
| 1989 | 18.4 | 25.0 | 27.1 | 32.7 | 25.8 | 33.9 | 23.9 | 21.6 | 17.8 | 19.5 | 11.8 | 14.9 | 20.0 | 28.8 | 27.0 | 16.7 | 23.5 | ||
| 1988 | 11.2 | 20.1 | 22.5 | 19.5 | 22.5 | 24.6 | 18.6 | 14.9 | 5.9 | 18.2 | 15.2 | 16.9 | 16.3 | 21.4 | 19.5 | 12.9 | 17.7 | ||
| 1987 | 36.4 | 6.7 | 15.8 | 16.0 | 19.1 | 16.6 | 19.0 | 12.1 | 10.0 | 12.8 | 16.2 | 7.4 | 8.7 | 17.2 | 15.6 | 13.1 | 14.8 | ||
| 1986 | 7.7 | 13.2 | 20.8 | 13.9 | 23.4 | 17.6 | 26.1 | 13.9 | 12.9 | 9.8 | 24.1 | 20.0 | 14.1 | 19.9 | 18.3 | 14.4 | 16.9 | ||
| 1985 | 6.7 | 6.7 | 5.8 | 8.1 | 7.0 | 6.7 | 50.0 | 35.3 | 27.3 | 15.8 | 30.0 | 10.7 | 8.0 | 7.2 | 16.5 | 22.5 | 10.8 | ||
| 1984 | 20.0 | 0.0 | 0.0 | 0.0 | 0.0 | 8.3 | 3.4 | 0.0 | 0.0 | 2.9 | 12.9 | 0.0 | 2.0 | 0.0 | 2.7 | 5.4 | 3.4 | ||
| 1983 | 0.0 | 8.3 | 0.0 | 0.0 | 0.0 | 0.0 | 0.0 | 0.0 | 0.0 | - | 0.0 | 0.0 | 3.4 | 0.0 | 0.0 | 0.0 | 1.0 | ||
| 1982 | - | 0.0 | - | 0.0 | 0.0 | 7.1 | - | 0.0 | - | 15.4 | - | 0.0 | 0.0 | 0.0 | 4.0 | 15.4 | 4.2 | ||
Breeding data
Breeding records by month
Number of breeding records by breeding code and month, 2017 and all years| Breeding code | Jul | Aug | Sep | Oct | Nov | Dec | Jan | Feb | Mar | Apr | May | Jun |
|---|---|---|---|---|---|---|---|---|---|---|---|---|
| 2017 | ||||||||||||
| Breeding (BLA code) | 0 | 0 | 0 | 0 | 0 | 0 | 0 | 0 | 0 | 0 | 0 | 0 |
| Carrying Food | 0 | 0 | 0 | 0 | 1 | 0 | 3 | 0 | 0 | 0 | 0 | 0 |
| Copulating | 0 | 0 | 0 | 0 | 0 | 0 | 0 | 0 | 0 | 0 | 0 | 0 |
| Display | 0 | 0 | 1 | 1 | 0 | 0 | 0 | 0 | 0 | 0 | 0 | 0 |
| Dependent young | 0 | 0 | 0 | 0 | 0 | 1 | 0 | 0 | 0 | 0 | 0 | 0 |
| Faecal sac | 0 | 0 | 0 | 0 | 0 | 0 | 0 | 0 | 0 | 0 | 0 | 0 |
| Inspecting hollow | 0 | 0 | 0 | 0 | 0 | 0 | 0 | 0 | 0 | 0 | 0 | 0 |
| Nest building | 0 | 0 | 0 | 0 | 0 | 0 | 0 | 0 | 0 | 0 | 0 | 0 |
| Nest with eggs | 0 | 0 | 0 | 0 | 0 | 0 | 0 | 0 | 0 | 0 | 0 | 0 |
| Nest with young | 0 | 0 | 0 | 0 | 0 | 0 | 1 | 0 | 0 | 0 | 0 | 0 |
| On/leaving nest | 0 | 0 | 0 | 0 | 0 | 0 | 1 | 0 | 0 | 0 | 0 | 0 |
| All years | ||||||||||||
| Breeding (BLA code) | 0 | 0 | 0 | 0 | 0 | 3 | 0 | 0 | 0 | 0 | 0 | 0 |
| Carrying Food | 0 | 0 | 1 | 16 | 15 | 12 | 16 | 1 | 1 | 0 | 0 | 0 |
| Copulating | 0 | 0 | 0 | 0 | 0 | 0 | 0 | 0 | 0 | 0 | 0 | 0 |
| Display | 0 | 1 | 2 | 10 | 0 | 0 | 0 | 0 | 0 | 0 | 0 | 0 |
| Dependent young | 0 | 0 | 0 | 0 | 1 | 4 | 6 | 2 | 0 | 0 | 0 | 0 |
| Faecal sac | 0 | 0 | 0 | 0 | 1 | 0 | 0 | 0 | 0 | 0 | 0 | 0 |
| Inspecting hollow | 0 | 0 | 0 | 0 | 0 | 0 | 0 | 0 | 0 | 0 | 0 | 0 |
| Nest building | 0 | 0 | 0 | 3 | 3 | 3 | 4 | 0 | 0 | 0 | 0 | 0 |
| Nest with eggs | 0 | 0 | 1 | 4 | 3 | 7 | 0 | 0 | 0 | 0 | 0 | 0 |
| Nest with young | 0 | 0 | 1 | 2 | 5 | 0 | 2 | 0 | 0 | 0 | 0 | 0 |
| On/leaving nest | 0 | 0 | 0 | 2 | 0 | 0 | 1 | 0 | 0 | 0 | 0 | 0 |
Breeding records by year
Average number of breeding records per period by breeding code| Period | Breeding (BLA code) | Carrying Food | Copulating | Display | Dependent young | Faecal sac | Inspecting hollow | Nest building | Nest with eggs | Nest with young | On/leaving nest |
|---|---|---|---|---|---|---|---|---|---|---|---|
| All years | |||||||||||
| All | 0.1 | 1.7 | 0.0 | 0.4 | 0.4 | 0.0 | 0.0 | 0.4 | 0.4 | 0.3 | 0.1 |
| Previous years | |||||||||||
| All previous years | 0.1 | 1.7 | 0.0 | 0.3 | 0.3 | 0.0 | 0.0 | 0.4 | 0.4 | 0.3 | 0.1 |
| Previous 30 years | 0.1 | 1.9 | 0.0 | 0.4 | 0.4 | 0.0 | 0.0 | 0.4 | 0.5 | 0.3 | 0.1 |
| Previous 20 years | 0.1 | 1.8 | 0.0 | 0.6 | 0.3 | 0.0 | 0.0 | 0.1 | 0.2 | 0.0 | 0.1 |
| 10 year groups | |||||||||||
| [2007,2017) | 0.2 | 2.3 | 0.0 | 0.9 | 0.4 | 0.0 | 0.0 | 0.2 | 0.2 | 0.1 | 0.1 |
| [1997,2007) | 0.1 | 1.2 | 0.0 | 0.2 | 0.2 | 0.1 | 0.0 | 0.1 | 0.3 | 0.0 | 0.1 |
| [1987,1997) | 0.0 | 2.3 | 0.0 | 0.0 | 0.6 | 0.0 | 0.0 | 1.0 | 1.0 | 0.7 | 0.0 |
| 5 year groups | |||||||||||
| [2012,2017) | 0.2 | 2.2 | 0.0 | 0.8 | 0.4 | 0.0 | 0.0 | 0.2 | 0.0 | 0.0 | 0.0 |
| [2007,2012) | 0.2 | 2.4 | 0.0 | 1.0 | 0.4 | 0.0 | 0.0 | 0.2 | 0.4 | 0.2 | 0.2 |
| [2002,2007) | 0.0 | 1.8 | 0.0 | 0.4 | 0.4 | 0.0 | 0.0 | 0.2 | 0.2 | 0.0 | 0.0 |
| [1997,2002) | 0.2 | 0.6 | 0.0 | 0.0 | 0.0 | 0.2 | 0.0 | 0.0 | 0.4 | 0.0 | 0.2 |
| [1992,1997) | 0.0 | 0.4 | 0.0 | 0.0 | 0.2 | 0.0 | 0.0 | 0.0 | 0.4 | 0.0 | 0.0 |
| [1987,1992) | 0.0 | 4.2 | 0.0 | 0.0 | 1.0 | 0.0 | 0.0 | 2.0 | 1.6 | 1.4 | 0.0 |
| Year | |||||||||||
| 2017 | 0.0 | 4.0 | 0.0 | 2.0 | 1.0 | 0.0 | 0.0 | 0.0 | 0.0 | 1.0 | 1.0 |
| 2016 | 0.0 | 4.0 | 0.0 | 2.0 | 0.0 | 0.0 | 0.0 | 0.0 | 0.0 | 0.0 | 0.0 |
| 2015 | 0.0 | 1.0 | 0.0 | 2.0 | 2.0 | 0.0 | 0.0 | 0.0 | 0.0 | 0.0 | 0.0 |
| 2014 | 0.0 | 3.0 | 0.0 | 0.0 | 0.0 | 0.0 | 0.0 | 0.0 | 0.0 | 0.0 | 0.0 |
| 2013 | 1.0 | 3.0 | 0.0 | 0.0 | 0.0 | 0.0 | 0.0 | 0.0 | 0.0 | 0.0 | 0.0 |
| 2012 | 0.0 | 0.0 | 0.0 | 0.0 | 0.0 | 0.0 | 0.0 | 1.0 | 0.0 | 0.0 | 0.0 |
| 2011 | 0.0 | 4.0 | 0.0 | 1.0 | 1.0 | 0.0 | 0.0 | 0.0 | 0.0 | 0.0 | 0.0 |
| 2010 | 0.0 | 3.0 | 0.0 | 0.0 | 1.0 | 0.0 | 0.0 | 1.0 | 0.0 | 0.0 | 1.0 |
| 2009 | 1.0 | 3.0 | 0.0 | 3.0 | 0.0 | 0.0 | 0.0 | 0.0 | 1.0 | 0.0 | 0.0 |
| 2008 | 0.0 | 2.0 | 0.0 | 1.0 | 0.0 | 0.0 | 0.0 | 0.0 | 1.0 | 1.0 | 0.0 |
| 2007 | 0.0 | 0.0 | 0.0 | 0.0 | 0.0 | 0.0 | 0.0 | 0.0 | 0.0 | 0.0 | 0.0 |
| 2006 | 0.0 | 0.0 | 0.0 | 1.0 | 0.0 | 0.0 | 0.0 | 1.0 | 0.0 | 0.0 | 0.0 |
| 2005 | 0.0 | 5.0 | 0.0 | 0.0 | 2.0 | 0.0 | 0.0 | 0.0 | 0.0 | 0.0 | 0.0 |
| 2004 | 0.0 | 1.0 | 0.0 | 0.0 | 0.0 | 0.0 | 0.0 | 0.0 | 0.0 | 0.0 | 0.0 |
| 2003 | 0.0 | 1.0 | 0.0 | 1.0 | 0.0 | 0.0 | 0.0 | 0.0 | 1.0 | 0.0 | 0.0 |
| 2002 | 0.0 | 2.0 | 0.0 | 0.0 | 0.0 | 0.0 | 0.0 | 0.0 | 0.0 | 0.0 | 0.0 |
| 2001 | 0.0 | 2.0 | 0.0 | 0.0 | 0.0 | 0.0 | 0.0 | 0.0 | 0.0 | 0.0 | 0.0 |
| 2000 | 1.0 | 0.0 | 0.0 | 0.0 | 0.0 | 1.0 | 0.0 | 0.0 | 0.0 | 0.0 | 0.0 |
| 1999 | 0.0 | 1.0 | 0.0 | 0.0 | 0.0 | 0.0 | 0.0 | 0.0 | 1.0 | 0.0 | 0.0 |
| 1998 | 0.0 | 0.0 | 0.0 | 0.0 | 0.0 | 0.0 | 0.0 | 0.0 | 0.0 | 0.0 | 1.0 |
| 1997 | 0.0 | 0.0 | 0.0 | 0.0 | 0.0 | 0.0 | 0.0 | 0.0 | 1.0 | 0.0 | 0.0 |
| 1996 | 0.0 | 0.0 | 0.0 | 0.0 | 0.0 | 0.0 | 0.0 | 0.0 | 0.0 | 0.0 | 0.0 |
| 1995 | 0.0 | 0.0 | 0.0 | 0.0 | 0.0 | 0.0 | 0.0 | 0.0 | 0.0 | 0.0 | 0.0 |
| 1994 | 0.0 | 0.0 | 0.0 | 0.0 | 0.0 | 0.0 | 0.0 | 0.0 | 1.0 | 0.0 | 0.0 |
| 1993 | 0.0 | 1.0 | 0.0 | 0.0 | 0.0 | 0.0 | 0.0 | 0.0 | 0.0 | 0.0 | 0.0 |
| 1992 | 0.0 | 1.0 | 0.0 | 0.0 | 1.0 | 0.0 | 0.0 | 0.0 | 1.0 | 0.0 | 0.0 |
| 1991 | 0.0 | 2.0 | 0.0 | 0.0 | 0.0 | 0.0 | 0.0 | 0.0 | 0.0 | 0.0 | 0.0 |
| 1990 | 0.0 | 1.0 | 0.0 | 0.0 | 0.0 | 0.0 | 0.0 | 0.0 | 2.0 | 0.0 | 0.0 |
| 1989 | 0.0 | 8.0 | 0.0 | 0.0 | 2.0 | 0.0 | 0.0 | 6.0 | 2.0 | 3.0 | 0.0 |
| 1988 | 0.0 | 4.0 | 0.0 | 0.0 | 3.0 | 0.0 | 0.0 | 2.0 | 1.0 | 2.0 | 0.0 |
| 1987 | 0.0 | 6.0 | 0.0 | 0.0 | 0.0 | 0.0 | 0.0 | 2.0 | 3.0 | 2.0 | 0.0 |
| 1986 | 0.0 | 0.0 | 0.0 | 0.0 | 0.0 | 0.0 | 0.0 | 0.0 | 0.0 | 1.0 | 0.0 |
| 1985 | 0.0 | 0.0 | 0.0 | 0.0 | 0.0 | 0.0 | 0.0 | 0.0 | 0.0 | 0.0 | 0.0 |
| 1984 | 0.0 | 0.0 | 0.0 | 0.0 | 0.0 | 0.0 | 0.0 | 0.0 | 0.0 | 0.0 | 0.0 |
| 1983 | 0.0 | 0.0 | 0.0 | 0.0 | 0.0 | 0.0 | 0.0 | 0.0 | 0.0 | 0.0 | 0.0 |
| 1982 | 0.0 | 0.0 | 0.0 | 0.0 | 0.0 | 0.0 | 0.0 | 0.0 | 0.0 | 0.0 | 0.0 |
Distribution map
Distribution - 2017
This map shows the observed distribution of the Australasian Pipit for 2017.
The red circles are the grid cells where Australasian Pipit have been reported.
The transparency of the red circles indicate how many surveys sheets were submitted for that grid cell; the darker the red the more reliable the data. Of the 315 grid cells with reports, 83 had only one sheet; an example is grid number A9.
The size of the circle represents the reporting rate. The maximum reporting rate for Australasian Pipit was 100.0% (eg grid number A9) and the minimum was 0.2% (eg grid number J12). 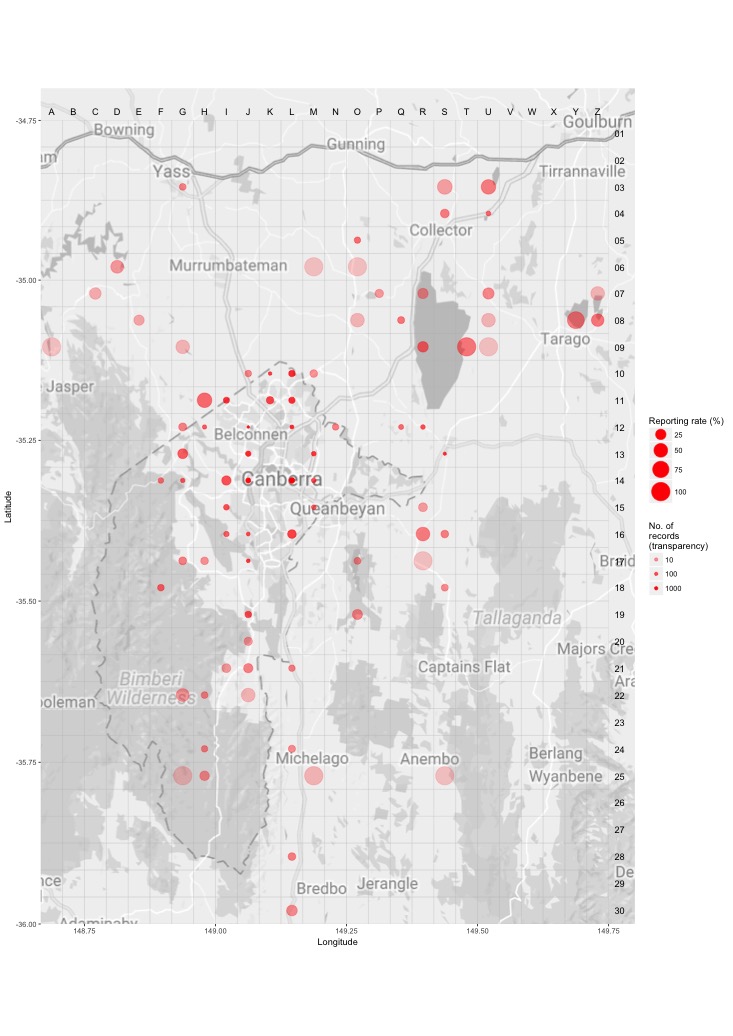
Distribution - all years
This map shows the observed distribution of the Australasian Pipit for all years.
The red circles are the grid cells where Australasian Pipit have been reported.
The transparency of the red circles indicate how many surveys sheets were submitted for that grid cell; the darker the red the more reliable the data. Of the 703 grid cells with reports, 55 had only one sheet; an example is grid number B13.
The size of the circle represents the reporting rate. The maximum reporting rate for Australasian Pipit was 100.0% (eg grid number B13) and the minimum was 0.2% (eg grid number K13). 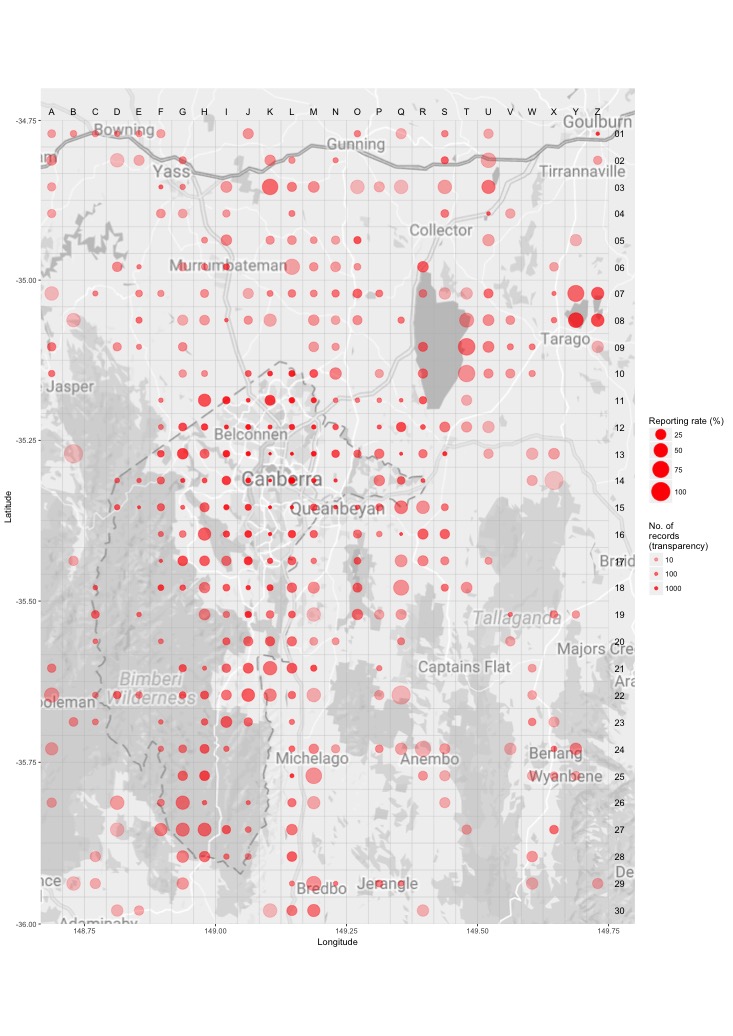
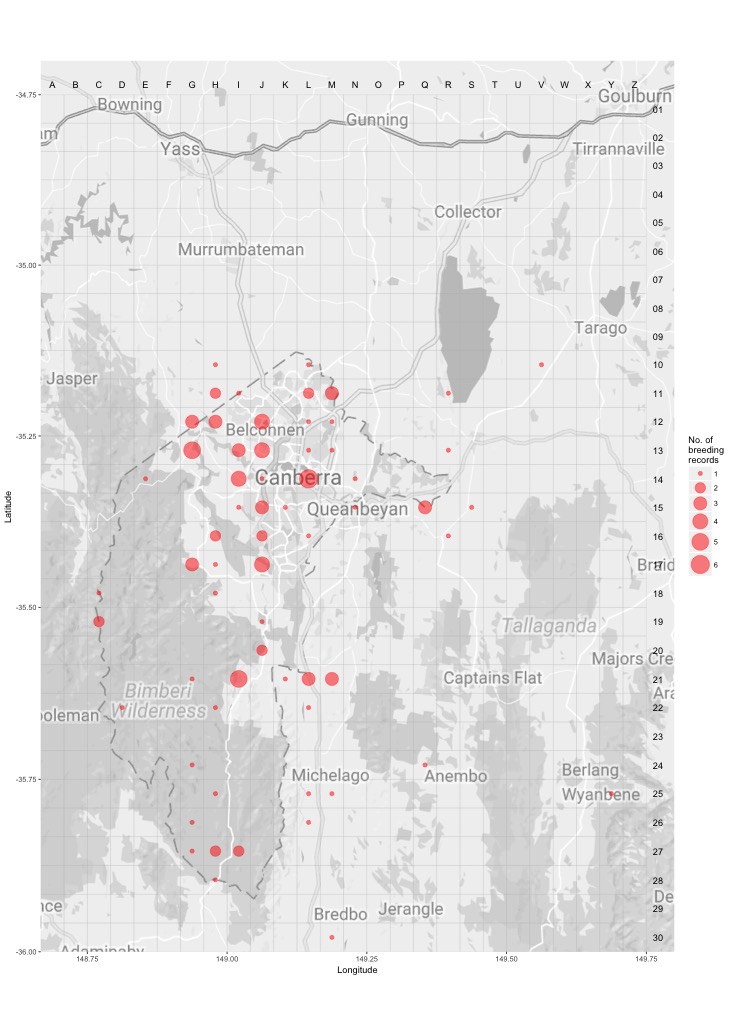
Breeding map
Breeding - 2017
This map shows the breeding distribution of the Australasian Pipit for 2017.
The red circles are the grid cells where breeding activity for Australasian Pipit have been reported.
The size of the circle represents the number of reports. 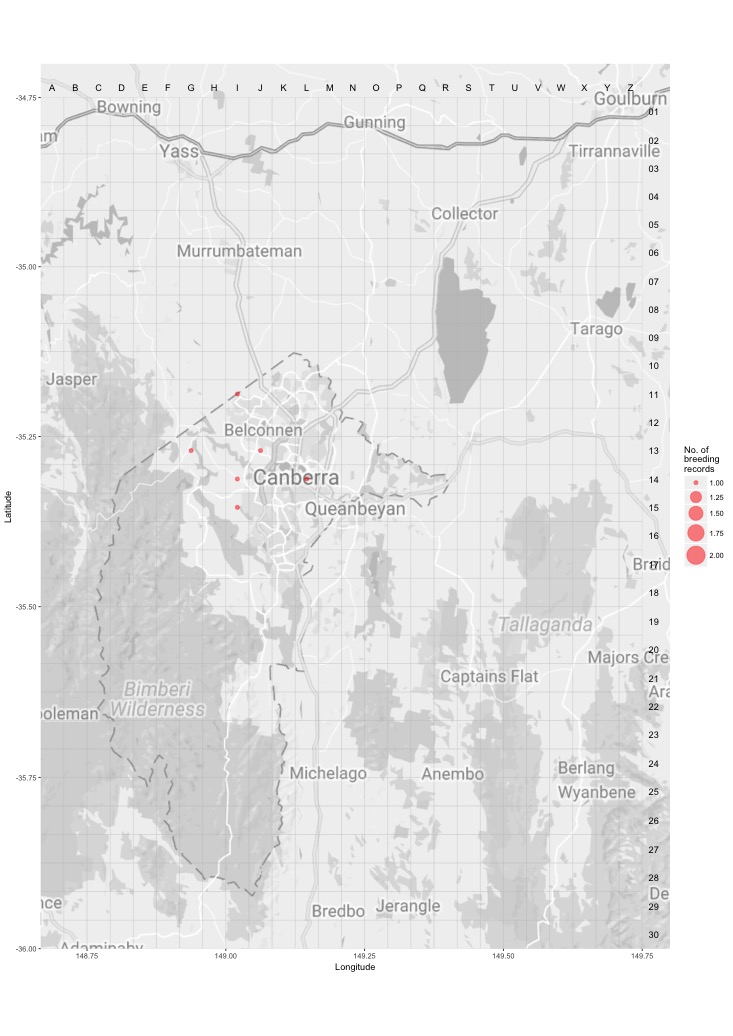
Breeding - all years
This map shows the breeding distribution of the Australasian Pipit for all years.
The red circles are the grid cells where breeding activity for Australasian Pipit have been reported.
The size of the circle represents the number of reports.